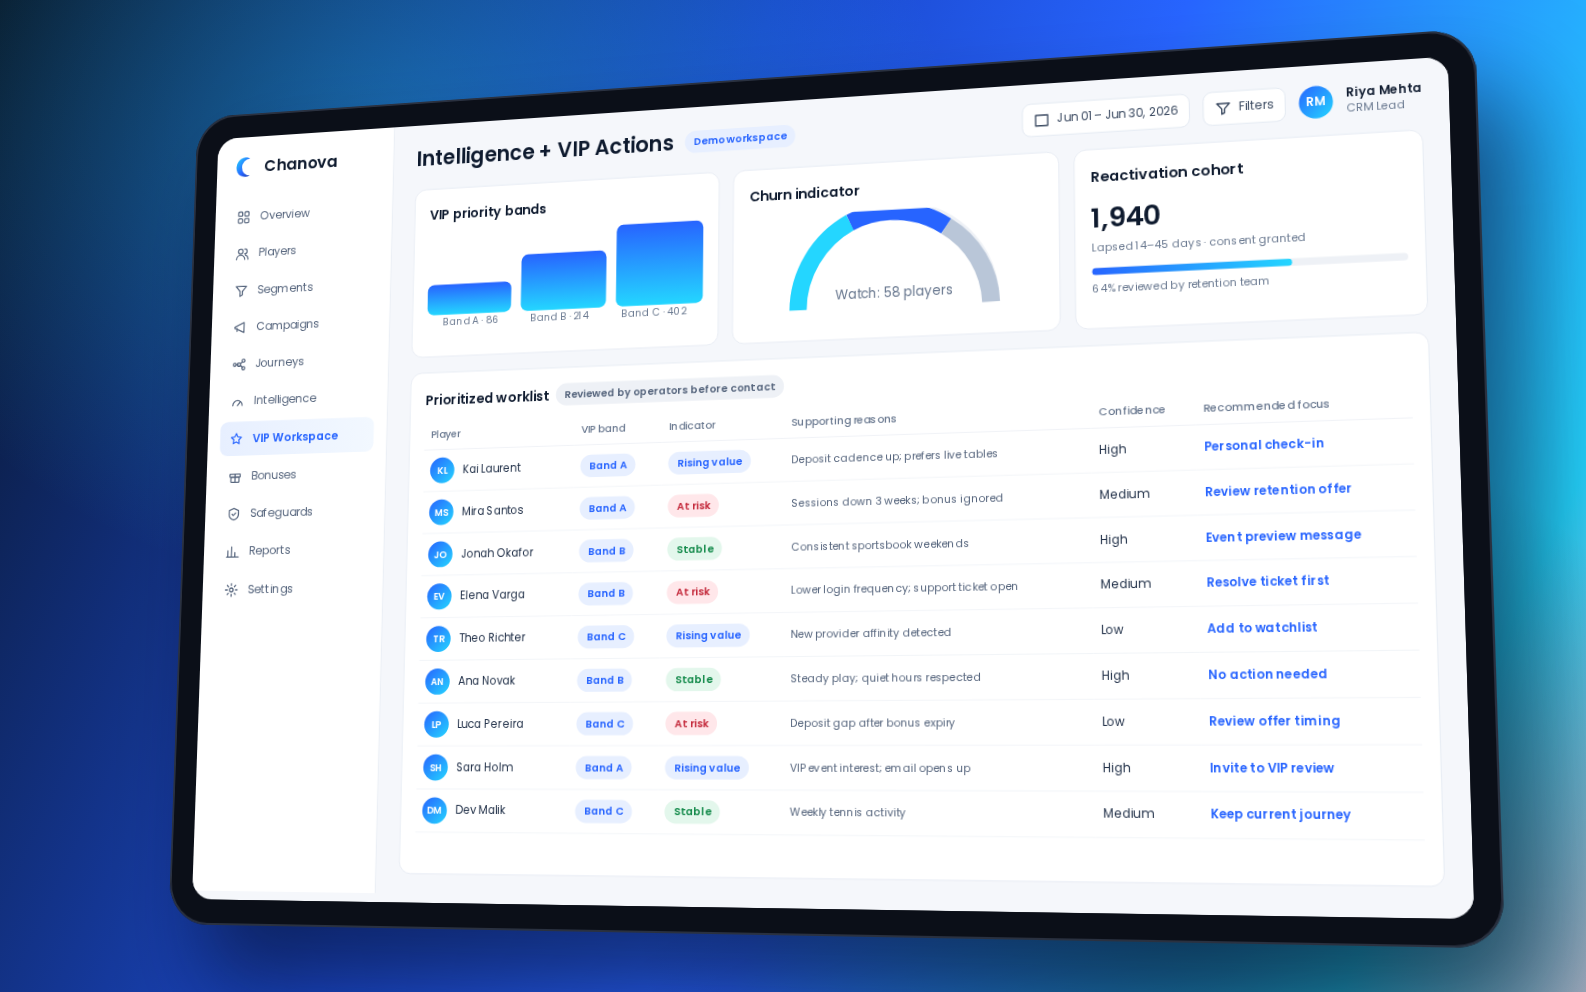

iGaming CRM KPIs measure audience eligibility, campaign delivery, player response, journey progression and selected business outcomes. Useful reporting connects each result to a defined player group, data source and observation window. However, a deposit after a message does not prove that the message caused it.
This guide helps casino and sportsbook CRM, retention, VIP and analytics teams choose metrics they can explain and act on. First, separate execution from outcomes. Then use consistent definitions and credible comparisons to assess impact. For the product context, Chanova iGaming CRM software connects player context, reviewed engagement and measurement.
Key Takeaways
- 01 Start with the decision Choose a small set of metrics for delivery, audiences, journeys, lifecycle outcomes and commercial review. →
- 02 Define the population and window Eligible, targeted, exposed and converted players describe different groups. State the outcome window. →
- 03 Separate credit from impact Attribution connects a touchpoint to a later action; incrementality estimates the additional effect. →
- 04 Keep the source traceable Reconcile financial results, track corrections and show report freshness before presenting a headline number. →
Choose iGaming CRM KPIs for Each Decision
A useful report answers an operating question. For example, a delivery failure needs a different response from weak conversion among successfully reached players. Therefore, do not combine every reporting layer into one performance score.
| Reporting layer | Question to answer | Useful starting measures |
|---|---|---|
| Delivery | Did the action execute? | Accepted, delivered, failed and pending actions |
| Audience | Who qualified and received it? | Exclusions, targeted players, exposure and contact frequency |
| Engagement | Did players interact? | Unique clicks, channel responses, opt-outs and complaints |
| Journey | Where did progression change? | Node counts, waits, branches, goals, errors and exits |
| Lifecycle and value | What happened afterwards? | Cohort retention, reactivation, contribution and cost |
| Incrementality | What changed because of the action? | Test-control differences with uncertainty reported |
Next, pair the headline KPI with a diagnostic measure and a safeguard. A reactivation report might show qualifying returns, delivery failures and opt-outs together. This helps the team investigate performance without treating more contact as success.
Also report player counts alongside rates. Averages can hide concentrated activity, while a high percentage from a small audience may be unstable. Compare like-for-like products, markets, channels and lifecycle groups before drawing conclusions.
Check Delivery Before Judging Engagement
Delivery reporting shows whether communication reached the provider and what happened next. First, distinguish the CRM's status from the provider's response. A queued action has not necessarily reached the player.
Keep execution statuses separate
Follow the action through attempted → queued → accepted → delivered, while recording failures and pending results separately. However, not every provider returns every status. A missing delivery receipt should remain unknown rather than become an assumed success.
Track temporary failures, permanent failures, retries and provider response time where available. Also preserve the latest result for each action. Otherwise, retries can inflate both send volume and failure counts.
State the delivery-rate denominator
One provider-focused definition is:
Delivery rate = delivered messages ÷ provider-accepted messages × 100
This measures delivery among accepted messages. It does not measure reach across the entire selected audience. Therefore, report suppressions and pre-provider failures separately instead of removing them from the operating picture.
For every rate, state the counting unit. Message counts and unique-player counts answer different questions. Likewise, distinguish one player's repeated delivery attempts from several players receiving one message each.
Treat tracking signals as diagnostics
Useful channel measures include unique click-through rate, click-to-open rate, opt-out rate, complaints and delivery cost. However, compare channels through signals they actually return. SMS delivery data does not provide an equivalent email-open event.
Email opens also have tracking limits. Privacy features and automated security checks can distort open and click data. Mailchimp explains these measurement limits. Therefore, review provider filtering and connect engagement with a qualifying player action rather than treating an open as proof of attention.
Separate Eligible, Targeted, Exposed and Converted Players
Audience reporting begins before the send. A player may match a commercial audience yet fail the current permission or account checks. Therefore, preserve each population and the reason for every exclusion.
players meeting the report's defined audience and eligibility conditions. If commercial matches precede permission checks, label that earlier group separately.
players selected for the approved action after the stated checks. Later restrictions can still prevent execution.
players with the defined exposure evidence, such as a provider-confirmed delivery. However, delivery does not prove that someone saw the message.
members of the chosen population who complete the qualifying goal within the fixed outcome window.
Next, track reach, offer redemption, suppression, exits and overlapping exposure. For example, distinguish a bonus request from a confirmed grant or redemption. Also show how often each player received communication across relevant campaigns and journeys.
Work through one campaign funnel
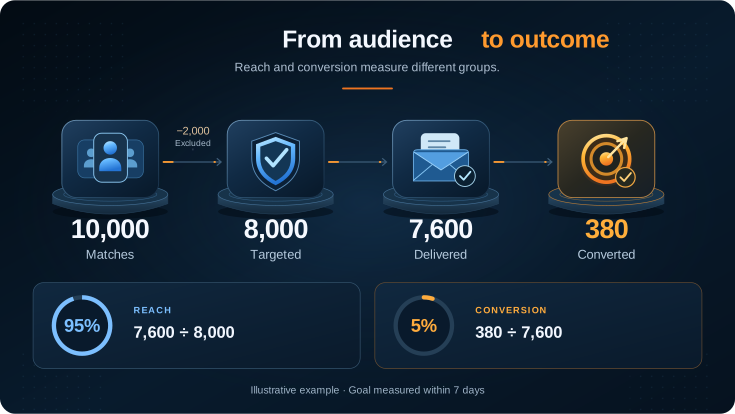
Consider an illustrative campaign with 10,000 initial audience matches:
- 01Eligibility checks exclude 2,000 players, leaving 8,000 targeted players.
- 02Provider records confirm delivery to 7,600 unique players.
- 03Within the agreed seven-day window, 380 of those players complete the defined goal.
Using delivery as the exposure definition, reach is 7,600 ÷ 8,000 = 95%. Meanwhile, exposed-player conversion is 380 ÷ 7,600 = 5%.
These are illustrative figures, not benchmarks or Chanova results. The conversion numerator includes only qualifying members of that denominator. If a different report uses all targeted players, state that definition and count their outcomes consistently.
Finally, distinguish an event count from a player count. One player making three deposits may represent three transactions but only one converted player. A zero denominator should produce an unavailable rate, not a misleading zero percent.
Read Journey Progression Alongside Goal Completion
A journey unfolds across decisions and waits. Therefore, the final conversion rate cannot explain where progression stopped. Start with eligible players, enrolments and active instances, then follow the workflow through its steps.
review population, time in step and branch distribution. Compare long waits with the configured timeout. A player waiting for an event is not automatically a failed conversion.
review provider results, errors, retries and reward fulfilment. Also separate requests from confirmed execution. This helps identify whether the issue sits in workflow logic or a connected service.
record the reason: completed goal, normal completion, timeout, changed eligibility or another approved stop. A protective exit can be correct behaviour, even when it reduces the audience receiving commercial communication.
Next, define goal-completion, timeout and early-exit rates against their appropriate populations. A node timeout rate should use instances entering that wait. It should not silently use every player in the CRM.
Preserve instance and version context
One player may enter a journey more than once. Therefore, report unique players and journey instances separately. Also identify the version, entry time and outcome window behind each result.
Compare mature versions on equivalent terms. For example, a recently published version may still contain players whose outcome windows remain open. Combining those players with completed cohorts can make its performance look weaker without showing a genuine decline.
Review question: can the team trace a reported goal back through the player's entry, branch, action result and exit?
Measure Lifecycle Outcomes With Consistent Definitions
Define active, retained, lapsing, inactive, churned, reactivated and VIP before choosing lifecycle KPIs. These labels depend on product behaviour and the reporting purpose. Therefore, avoid presenting one universal inactivity threshold as suitable for every operator.
Early engagement and retention
For early engagement, review registration-to-first-deposit conversion, first-to-second-deposit conversion, time to qualifying activity and onboarding completion. Also check initial active days and the defined first product interaction. A welcome-email open alone does not establish meaningful onboarding.
For retention, follow the same starting players over time:
Cohort retention rate = starting-cohort players meeting the checkpoint activity rule ÷ starting-cohort players in scope × 100
State the qualifying activity, checkpoint and exclusions. For example, activity on day seven differs from activity at any time during the first seven days. Neither definition should silently replace the other.
Also monitor repeat activity, active days, sessions, deposit frequency and lapsing-player movement. Compare cohorts by product, acquisition source or lifecycle stage where useful. However, total active players this month divided by last month's total is not a cohort-retention measure. New players can mask losses from the original group.
Reactivation and the durability of a return
Reactivation starts with previously active players meeting a defined inactivity rule. Then distinguish eligible inactive players, reached players and qualifying returns.
Exposed-player reactivation rate = qualifying returning players ÷ exposed eligible inactive players × 100
This describes returns among the reached audience. However, it does not establish how many returns the communication caused. Keep experimental impact separate from this operating rate.
Next, review time to return, cost per reactivated player and repeat activity after return. Follow later active days or qualifying activity within another fixed window. This separates a single return event from sustained engagement without assuming either result is incremental.
VIP review quality and safeguards
VIP reporting should cover the review process alongside player activity. Track assigned and completed reviews, time to first review, approved personal actions and cases closed without action. Also record offer fulfilment, contact restrictions and automated actions paused for human review.
More offers or contacts do not necessarily mean better VIP operations. Instead, assess whether the team reviewed the right context and followed the approved process. Keep player-protection restrictions visible, and do not treat successful commercial outcomes as permission to bypass them.
The UK Gambling Commission’s customer interaction guidance for remote licensees sets out an ongoing process: identify risk, act to minimise harm, and evaluate the response. Apply the relevant requirements when reviewing VIP safeguards in Great Britain.
Fix Cohorts, Reporting Periods and Outcome Windows
These three concepts describe different parts of the report. First, decide who belongs in the population. Then decide which activity and dates the analysis covers.
Examples include registration in one week, a first deposit in one month or entry to one journey version. Follow those players at consistent checkpoints to compare retention, second deposits, product adoption or later value.
Daily deliveries, weekly failures and monthly revenue belong to this view. However, a calendar total does not explain how one starting cohort developed.
For example, count a qualifying return within seven days of exposure. Set the rule before reviewing results, including the time zone, start event and final cut-off.
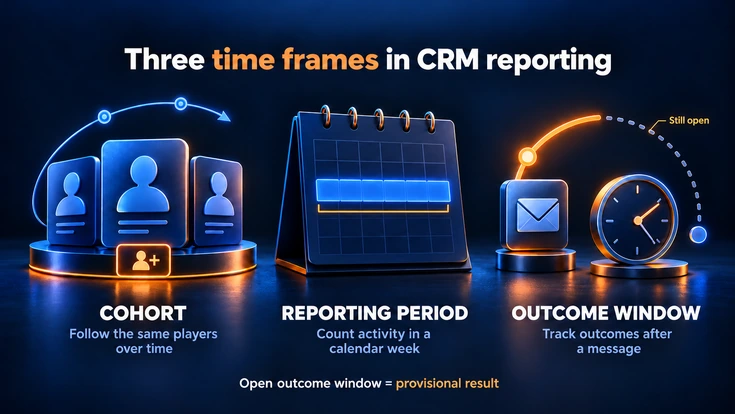
Also distinguish complete from incomplete windows. A campaign sent yesterday cannot yet provide a full seven-day outcome. Mark its results as provisional rather than comparing them directly with a mature campaign.
Finally, preserve the original window when comparing campaigns. Extending it after seeing weak results changes the question. A longer window can also include more unrelated exposures and natural player activity.
Separate Attribution From Incremental Impact
Attribution assigns credit under a reporting rule. Incrementality estimates the additional outcome caused by the tested action. Therefore, a report should name the method rather than label both results as campaign impact.
Attribution records a relationship
A player might click an email and complete a qualifying deposit within the agreed window. A click-based rule can attribute that outcome to the email. However, the sequence does not establish what the player would have done without it.
Google Analytics explains how attribution assigns credit across touchpoints. First-touch, last-touch, exposure-based, journey-based and multi-touch rules distribute credit differently. Also document competing campaign exposure. Otherwise, separate reports may each claim the same player's entire outcome.
A control group provides a comparison
Google's Conversion Lift guide explains treatment-control comparisons for advertising. In a CRM test, define the treatment, control conditions and outcome before applying that comparison.
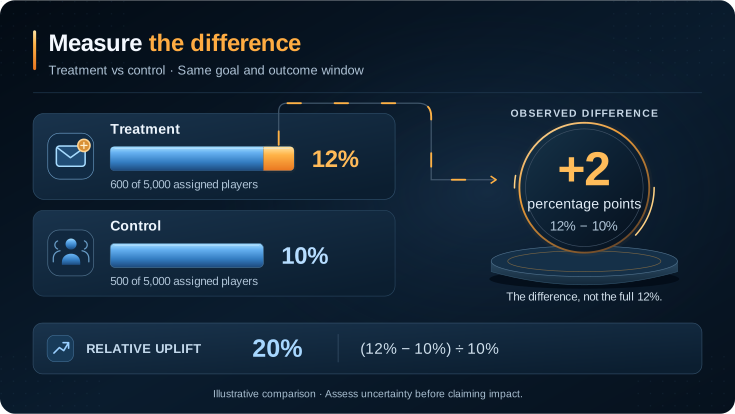
For an illustrative randomised test, assign 5,000 eligible players to treatment and 5,000 to control. Suppose 600 treatment players and 500 control players meet the same goal within the fixed window.
- Treatment conversion: 600 ÷ 5,000 = 12%.
- Control conversion: 500 ÷ 5,000 = 10%.
- Absolute difference: 12% − 10% = 2 percentage points.
- Relative uplift: (12% − 10%) ÷ 10% × 100 = 20%.
The full 12% should not become a claim of incremental conversion. The observed difference is two percentage points. However, these example figures alone do not prove a reliable or repeatable campaign effect.
For experimental analysis, preserve the randomised groups and use an agreed time origin for both. Do not remove failed deliveries from treatment while retaining everyone in control. That can break comparability. Keep exposure-based operating rates alongside the assigned-group analysis, with each denominator clearly labelled.
Protect the comparison and report uncertainty
Keep control players outside the tested treatment, including equivalent offers through other workflows. Also record assignment, contamination, overlapping campaigns and later restrictions. Protective and essential operational communications still follow their approved rules.
Before launch, agree the outcome, window, allocation, sample-size plan and analysis method. Then report uncertainty and the effect's practical value. A large relative uplift from a tiny audience can be misleading. Likewise, a statistically detectable difference may be too small to justify its cost.
If the control rate is zero, relative uplift is undefined. Report the underlying counts and absolute difference instead. Finally, avoid repeatedly changing the analysis until a favourable result appears.
Connect Financial Outcomes Without Double-Counting Costs
Commercial reporting can include deposits, deposit frequency, gross gaming revenue, net gaming revenue, bonus cost and contribution. However, a deposit is cash entering an account, not automatically gaming revenue. Keep the underlying transaction and gaming records authoritative.
Use the operator's financial dictionary
Finance should approve the definitions for GGR, NGR, bonus cost and contribution. Deductions can vary by operating model. Therefore, do not introduce a separate CRM formula that conflicts with the finance report.
Also distinguish requested, granted, redeemed, settled and reversed rewards. A bonus's face value may differ from its recognised cost. Compare currencies only after applying the approved conversion policy and exchange-rate date.
For revenue per player, define both the revenue measure and player population. Likewise, separate realised lifetime value from a prediction. A model estimate needs a stated horizon and assumptions; it is not confirmed future revenue.
Calculate ROI from a clearly defined incremental result
Where the comparison supports it, a practical definition is:
CRM ROI = (incremental contribution before CRM activity costs − CRM activity costs) ÷ CRM activity costs × 100
First, reconcile which costs already sit inside contribution. Then subtract only the costs not already deducted. Otherwise, bonus or provider costs can enter the calculation twice.
Document communication, reward, technology and operating costs included in the calculation. Also state the window, comparison method and treatment of reversals. If the cost denominator is zero, the ratio is undefined.
Without a credible incremental estimate, label the result as observed or attributed performance. Do not present it as proven CRM ROI. Also avoid adding individual campaign uplift figures into one programme total without checking overlap and interaction effects.
Make Every KPI Traceable to Its Source
The CRM can combine records from several systems. However, displaying a metric does not make the CRM its authoritative source. Assign ownership before reconciling campaign and financial reports.
Identify the authoritative record
- CRM: audience selection, campaign exposure logs, segment movement, journey enrolment and progression.
- Messaging provider: delivery receipts, failures and available channel responses, recorded back into the CRM.
- PAM or core platform: player identity, account status and relevant operational records.
- Gaming, wallet, payment or finance systems: approved transaction, betting, revenue and bonus-settlement records, according to the implementation.
- Approved preference and protection systems: current consent, suppression and relevant restrictions.
- BI or reconciled analytics: cross-system reporting using the agreed sources and definitions.
Next, make the route from headline KPI to underlying records inspectable. An outcome should connect to the correct player, exposure, campaign or journey version, source event and time window.
Maintain a shared KPI dictionary
For each KPI, document its purpose, formula, numerator, denominator and counting unit. Also record the source, owner, time zone, currency policy, observation window, refresh frequency and known limitations.
Preserve changes to those definitions. For example, changing an active-player rule can alter retention without any underlying behaviour change. Therefore, identify the definition version behind historical comparisons.
Reconcile corrections and show freshness
Test duplicate, late, corrected and reversed events. Also check missing identifiers, incomplete provider statuses, mismatched brands and bonus requests without fulfilment results. Record whether the report uses event time or processing time.
When a correction changes a published result, show the affected period and recalculation status. Keep an audit trail of material revisions. Meanwhile, display source freshness separately where data updates at different speeds.
Use a cadence that suits the decision:
- Live or intraday: investigate queues, failures, suppressions and unusual journey states.
- Daily: review delivery, audience movement and provisional campaign outcomes.
- Weekly: compare mature lifecycle cohorts, journey versions and channel trends.
- Monthly: reconcile commercial results, costs and leadership reporting.
- Experiment close-out: evaluate the fixed window, comparison quality and uncertainty.
Finally, distinguish a preliminary dashboard from a reconciled financial result. A report refreshing quickly does not mean every upstream record is complete.
Evaluate Reporting With One End-to-End Demonstration
A dashboard screenshot cannot establish data quality or reporting depth. Instead, ask the vendor to demonstrate one realistic campaign using controlled records.
- Define the report. Set the audience, goal, counting unit, denominator and outcome window. Then identify the metric owner.
- Inspect execution. Trace exclusions, provider acceptance, delivery, failed actions and qualifying outcomes at player level.
- Follow a journey. Inspect nodes, waits, branches, errors, exits and version-specific results. Also distinguish players from instances.
- Check the comparison. Review assignment, control-group protection, overlapping exposures, uncertainty and uplift calculations.
- Correct the source. Amend a transaction or delivery result. Then inspect the recalculation, historical record and export.
Also evaluate saved views, permissions, exports and BI connections. Confirm how brands, currencies, markets and time zones remain distinct. Request evidence of reporting volumes and freshness under a realistic workload rather than accepting an undefined “real-time” claim.
This exercise reveals more than a long feature checklist. However, keep operational diagnosis separate from a statistical claim. A platform can display a campaign funnel correctly without proving that the campaign changed player behaviour.
How Chanova Supports iGaming CRM Reporting
Chanova connects player context, segments, campaigns, journeys, channels and reviewed lifecycle decisions. Its reporting approach links engagement activity with outcomes, exposures and experiments. However, available data and provider feedback depend on the configured implementation.
The approved product documentation covers campaign funnels, recipient drill-down, journey statistics, enrolment states and player timelines. It also describes retention cohorts, saved views, exports, daily rollups and configured control-group analysis. Confirm the required views, definitions, access and reconciliation behaviour during discovery.
Financial and transaction records remain authoritative in their assigned operator systems. Likewise, AI assistance does not replace an analyst's judgement or operator approval. Teams should review the data, methodology and proposed action before acting on a reported opportunity.
Conclusion
iGaming CRM KPIs become useful when teams can explain who entered the audience, what executed and which outcome followed. Clear denominators, mature observation windows and traceable records make those explanations easier. However, delivery, engagement, attributed performance and incremental impact remain different kinds of evidence.
Start with one campaign and a small, agreed KPI set. Then reconcile the sources, inspect exceptions and test the comparison before expanding the dashboard. The aim is a report that supports a defensible operating decision, rather than a larger collection of numbers.
Frequently Asked Questions
01What are iGaming CRM KPIs?
iGaming CRM KPIs measure audiences, delivery, communication response, journey progression and selected lifecycle or commercial outcomes. Each needs a defined population, source and reporting window. However, opens, clicks and deposits after exposure do not establish incremental impact. A useful report explains both the result and the limits of the measurement.
02Which CRM KPIs should casino and sportsbook operators track?
Start with delivery and failure rates, eligible and exposed players, campaign conversion, journey goals, retention and reactivation. Also track contact frequency, opt-outs and relevant commercial measures. Add test-control results where the methodology supports them. However, choose definitions for the operator's products and data; avoid treating generic industry targets as universal benchmarks.
03How should campaign conversion rate be calculated?
Divide qualifying converted players by the defined population, then multiply by 100. For exposed-player conversion, both numerator and denominator must refer to that exposed group. Also state the goal, exposure rule, observation window and treatment of repeated actions. A targeted-player rate may also be useful, but label it separately and use a consistent numerator.
04How do retention and reactivation reporting differ?
Retention follows whether a starting group continues meeting a qualifying activity rule. Reactivation follows previously active players who became inactive and later complete an approved return action. Both need a fixed population and time window. Also review activity after a return; one qualifying event does not establish sustained retention or prove that communication caused it.
05What is the difference between attribution and incrementality?
Attribution assigns credit to a touchpoint under a defined rule, such as a click before a deposit. Incrementality estimates what changed because of the tested action. Therefore, attribution alone does not establish causal impact. A credible experimental comparison also needs comparable groups, consistent timing, suitable analysis and controls against competing exposure.
06Why do control groups matter in iGaming CRM reporting?
Control groups provide a baseline of eligible players outside the tested treatment. Comparing results can help estimate incremental effects. However, randomisation, sample size, outcome definitions and uncertainty still matter. Also protect the comparison from equivalent offers through other workflows. Keep assigned-group analysis separate from exposure-based rates so delivery failures do not distort the comparison.
07Which system should own deposits, NGR and bonus-cost data?
Use the operator's assigned transaction, gaming, wallet, payment, bonus or finance systems as authoritative sources. Finance should approve revenue and cost definitions. The CRM can use those records for reporting, but it should not create a competing financial ledger. Also preserve settlement, reversals, currency rules and material corrections when reconciling results.
08What should operators evaluate in CRM reporting software?
Evaluate audience traceability, campaign and journey reporting, provider feedback, financial inputs, cohorts and outcome windows. Also inspect control groups, attribution, corrections, permissions, exports and validated freshness. Ask the vendor to trace one controlled player from eligibility to outcome, then correct a source event. The report should show what changed and why.